Telemetry
The telemetry plugin exports traces information about Conductor to a telemetry backend.
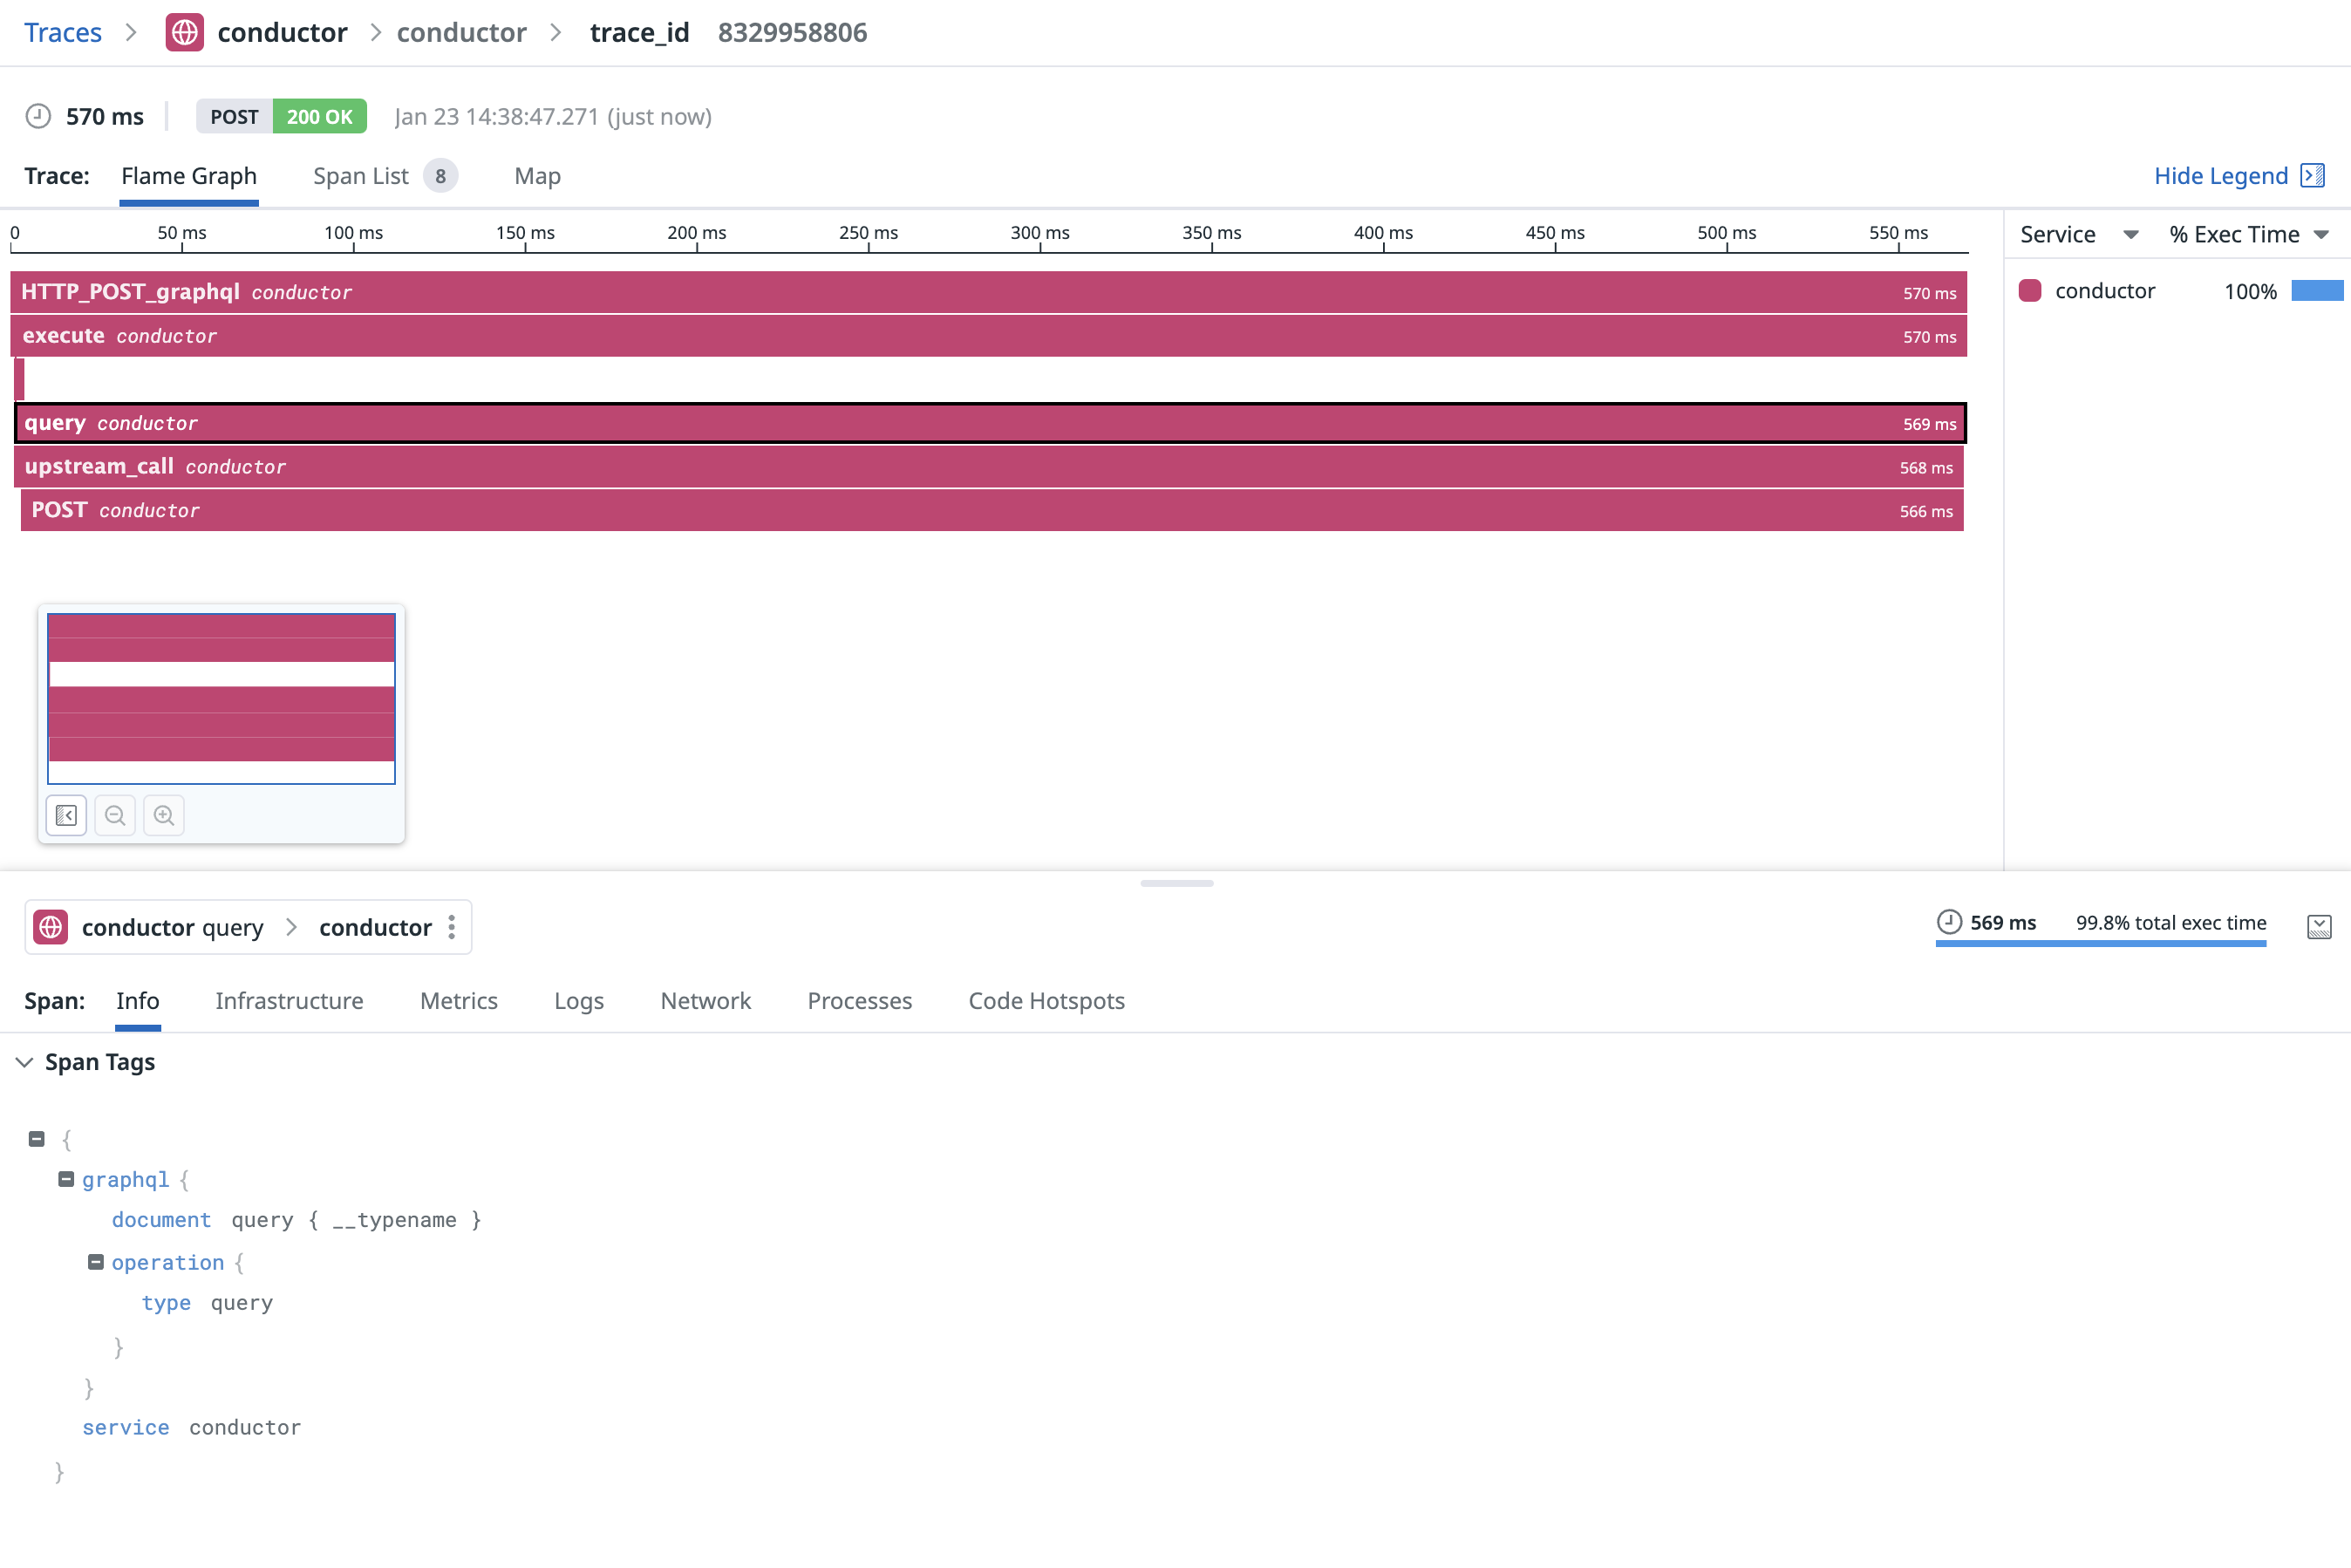
The telemetry plugin exports traces information about the following aspects of Conductor:
-
GraphQL parser (timing)
-
GraphQL execution (operation type, operation body, operation name, timing, errors)
-
Query planning (timing, operation body, operation name)
-
Incoming HTTP requests (attributes, timing, errors)
-
Outgoing HTTP requests (attributes, timing, errors)
When used with a telemtry backend, you can expect to see the following information:
Configuration
Reference
service_name"conductor"Configures the service name that reports the telemetry data. This will appear in the telemetry data as the service.name attribute.
targetsA list of telemetry targets to send telemetry data to.
The telemtry data is scoped per endpoint, and you can specify multiple targets if you need to export stats to multiple backends.
stdout
Sends telemetry data to stdout in a human-readable format.
Use this source for debugging purposes, or if you want to pipe the telemetry data to another process.
typestdoutTo use this variation, please specify the type: stdout in your configuration.
zipkin
Sends telemetry traces data to a Zipkin collector, using the HTTP protocol.
To get started with Zipkin, use the following command to start the Zipkin collector and UI in your local machine, using Docker:
docker run -d -p 9411:9411 openzipkin/zipkin
typezipkinTo use this variation, please specify the type: zipkin in your configuration.
collector_endpoint"http://127.0.0.1:9411/api/v2/spans"The Zipkin endpoint. Please use full URL endpoint format, e.g. http://127.0.0.1:9411/api/v2/spans.
Open Telemetry (OTLP)
Sends telemetry traces data to an OpenTelemetry backend, using the OTLP protocol.
You can find here a list backends that supports the OTLP format.
typeotlpTo use this variation, please specify the type: otlp in your configuration.
endpointThe OTLP backend endpoint. The format is based on full URL, e.g. http://localhost:7201.
protocol"grpc"The OTLP transport to use to export telemetry data.
❗️ The gRPC transport is not supported on WASM runtime (CloudFlare Worker).
grpcUses GRPC with tonic to send telemetry data.
httpUses HTTP with http-proto to send telemetry data.
timeout"10s"Export timeout. You can use the human-readable format in this field, e.g. 10s.
gzip_compressionfalseWhether to use gzip compression when sending telemetry data.
Please verify your backend supports and enables gzip compression before enabling this option.
Datadog
Sends telemetry traces data to a Datadog agent (local or remote).
To get started with Datadog, make sure you have a Datadog agent running.
typedatadogTo use this variation, please specify the type: datadog in your configuration.
agent_endpoint"127.0.0.1:8126"The Datadog agent endpoint. The format is based on hostname and port only, e.g. 127.0.0.1:8126.